Kevin Warsh will be sworn in as the new chair of the Federal Reserve this Friday, ending the nearly year-long saga led by the President to select Jerome Powell’s successor. While in the past I have voiced my opinion on the effectiveness and importance of the Federal Reserve, the current situation Warsh will find himself overseeing will likely be far more convoluted than he was hoping.
Much of the search for a new chair revolved around their willingness to reduce interest rates, something the President has been adamant is necessary to improve the economy. While the President claims that a decrease in rates will bring down mortgage rates and reduce the burden of the national debt, the data and actions of the current administration are inconsistent with these goals.
Thanks for reading Jack’s Newsletter! Subscribe for free to receive new posts and support my work.
The “One Big Beautiful Bill,” passed in 2025 and the signature policy accomplishment of the current administration thus far, is projected to contribute north of $3.5 trillion to the deficit alone over the next 10 years. The current 30-year fixed mortgage rate sits at 6.75%, which is slightly higher than the 6.55% low of March 2025 and the 6.2% low of September 2024, when the target federal funds rate was 75 bps and 125 bps higher, respectively.
Warsh himself built a career with a hawkish personality. His 2012 speech at Stanford University, where he openly lobbied against lower interest rates and quantitative easing by the Fed, is completely contrarian to the views he now portrays that earned him the job.
Warsh has now found himself as a vocal critic of Jerome Powell’s decisions over the last couple of years not to aggressively cut rates. Whether this was a newfound opinion or political posturing, the situation ahead remains the same. Several months ago, Warsh likely could have justified cutting rates a bit more aggressively than his predecessor, even if the data deemed it a bit of a stretch. Yet since then, the war in Iran broke out, causing energy prices to surge and spreading fears of another period of hot inflation in the American economy. March’s PCE data already came in at 3.5%, up from 2.8% in February, and many of the effects from the war would not yet have been baked into the data. The Federal Reserve Bank of Cleveland is now projecting a 3.8% headline PCE number for April 2026, which will be officially reported on May 28th.
Warsh finds himself in the precarious situation of wanting, maybe even promising, to cut interest rates in the face of inflation data that does not support it and appears to be only worsening.
Nevertheless, the changing of the guard at the top of the Federal Reserve is not a common occurrence. As someone who values how markets have historically reacted to changes in geopolitics, presidential cycles, fiscal policy, and monetary policy, I wanted to run some numbers on the historical performance of markets following the start of a new Fed chair’s reign.
Much of what I found appeared to be inconclusive at best. The S&P and Nasdaq returns leading up to the transition of a chair change had no pattern indicating future returns.
Dating back to 1987, four different individuals have held the role of chair. Greenspan was at the helm from 1987 to 2006, Ben Bernanke led from 2006 to 2014, Janet Yellen, who later became only the second person ever to lead both the Fed and the U.S. Treasury, served as chair from 2014 to 2018, and Jerome Powell has been in charge since being appointed by the current president during his first term in 2018.
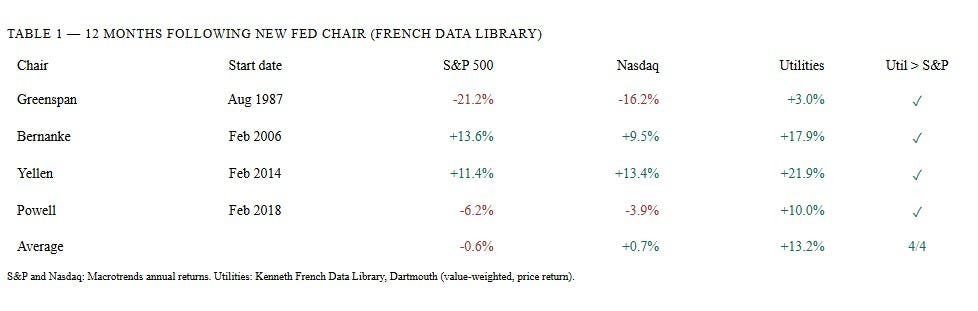
The varying S&P and Nasdaq returns in the 12 months following the beginning of each of the aforementioned chairs’ respective terms are quite varied. Greenspan took over right before the crash in the fall of ‘87, so his numbers are rather poor. Bernanke and Yellen both experienced slightly above-average historical annual returns posted by the S&P, while markets rewarded investors with a modest 3.4% gain during Powell’s first 12 months.
Yet the performance of the utilities sector did end up providing some insightful data on where to find alpha given the current unpredictability surrounding Warsh, geopolitics, and the economy.
In the 12 months that followed the start of the Greenspan, Bernanke, Yellen, and Powell regimes, the utilities sector outperformed the S&P on all four occasions. In order to calculate utility sector returns, the data will be sourced from the Kenneth French Data Library (Dartmouth), which tracks value-weighted returns of all U.S.-listed utility stocks by SIC code. The Greenspan data is perhaps the most intriguing of the four Fed chairs, as his term began just two months before the Black Monday crash of 1987. The major indexes experienced pullbacks of around 21% over the next 12 months, while the utilities sector actually returned a positive 3.0% over the same timeline.
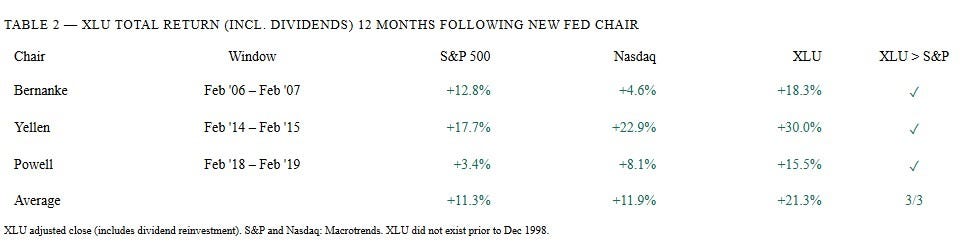
The introduction of the State Street Utilities Sector ETF (Ticker: XLU) allows us to use more modern market data to analyze the performance of the sector against the indexes. The data here reaffirms utility outperformance.
The strong returns for the utilities sector following the transition of Fed chair may not come as a surprise. A rotation into a defensive sector during a period of uncertainty regarding monetary policy does make sense.
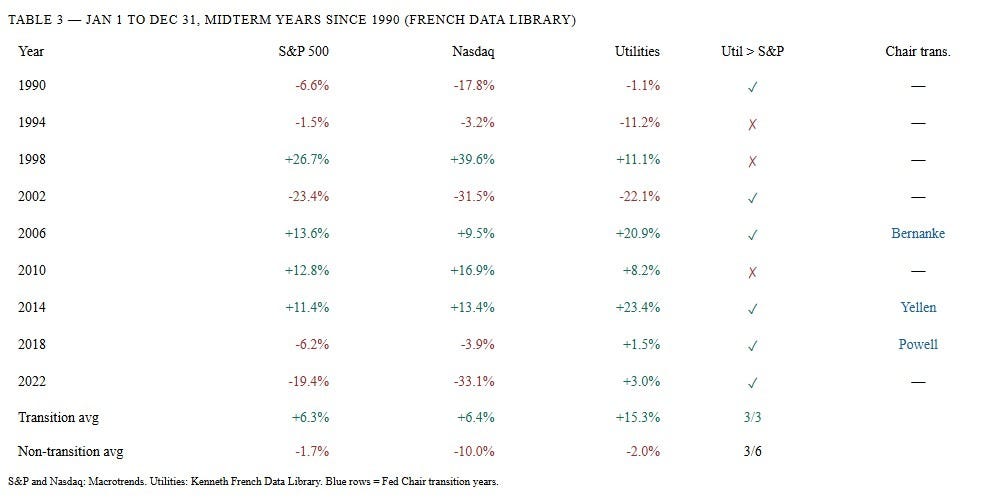
While the data seemed conclusive, there are a variety of alternate possibilities that could explain the sector’s outperformance. Historically, the average annual returns posted by the major averages in midterm years are the worst in the four-year presidential cycle. Given the fact that Bernanke, Yellen, and Powell all began their terms in February of midterm years, I ran the numbers on the average annual return of the utilities sector in midterm years to see if the returns mentioned above could be credited to coincidence given the timing of their start dates.
The midterm data shows that the returns in utilities seen in Bernanke, Yellen, and Powell’s first year were not consistent with the returns utilities traditionally experience in a midterm cycle. Dating back to 1990, there have been nine different midterm elections in the United States. During the six years where there was not a transition of Fed leadership, the utilities sector outperformed the indexes only on three occasions: 1990, 2002, and 2022. While utilities outperformed the broader market in those three years, only in 2022 did the sector actually provide a positive return, posting gains of 3.0%.
As we approach June, some may fear that this data may not be analogous to our current situation. Bernanke, Yellen, and Powell all began their terms in February. One could argue Warsh may not earn the same seasonality benefit to the sector that his predecessors experienced. Thus, I calculated the return for the indexes and the sector from June 1 up to Election Day. The data indicates that seasonality does not limit the potential in the utilities sector for Warsh’s first 12 months.
In 2006, the S&P experienced a 7.6% return from June 1 to Election Day, while utilities returned 13.3%. In 2014, the S&P returned 4.5% compared to utilities’ 7.2% return over the same timeline. The market followed a similar trend for Powell as well, with the S&P posting a 0.8% return while utilities came in at 4.6%.
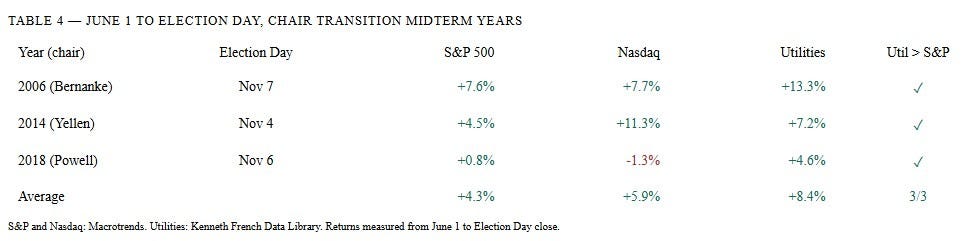
The trend, as you see above, is not as common in midterm years where there was not a transition of Fed chair, ruling out the argument that this could simply be part of the rotation into utilities during the midterm year of the presidential cycle.
One other point worth mentioning is the previous 12 month performance for the indexes and the utilities sector. The S&P has posted returns of 24.5% over the last year with the NASDAQ outpacing it at a staggering 36.4%. Meanwhile the XLU has only seen a return of 7.9%, lessening the possibility that this trade could already be priced in.
It is worth noting that although the data shows a 100% win rate for Utilities against the S&P, the sample size is small. Four transitions of Fed leadership over a 40-year period makes it difficult to gauge how much significance the data holds.
When Warsh officially takes over this week, the challenge he faces is steep. The President, who likely required some kind of commitment to bringing down rates, will be constantly pushing him, all while inflation is expected to remain hot. Coupled with the fact that we are in the midst of a three-year bull market, pressure from other Fed board governors to hike rates, a war causing a surge in energy prices, and a midterm election, it is not clear how he can or should move forward. What is clear, though, is the relative strength of the utilities sector following Fed chair transitions, regardless of market performance, seasonality, and presidential cyclicality.
This piece is for informational and research purposes only and does not constitute investment advice. All data is sourced as cited. Past performance is not indicative of future results.
Thanks for reading Jack’s Newsletter! Subscribe for free to receive new posts and support my work.